2014 / Concept app
03. Renault Connect

What if we could resign the concept of connected cars through an application?
Context
During a hackathon organized by Fiesp in São Paulo, Renault Brazil sought to improve the way it connected with its customers. Given this scenario, the need to collect vehicle usage data to help think about new business models was one of the requirements of the challenge.
Solution
The solution was to create a technology concept in an app format that connects via Bluetooth with Renault vehicles. This same app collects vehicle usage data such as fuel usage, oil changes, and maintenance notices, and this proposal aims to help generate insights to create new ways to meet the user's needs, offer personalized services and driver behavior.
Project goal
- Validate a business concept according to Renault's needs and with this, collect data for the assembler
- Test hypotheses with real users to understand their motivations and pains
My role
Research and Interaction Design
Time of project
2 full-days
01. Framing the problem
Understanding the context
Renault wanted to get closer to its customer by providing better maintenance and data collection services. The target audience was not only the drivers but also the automakers and dealers that do not have solid customer data.
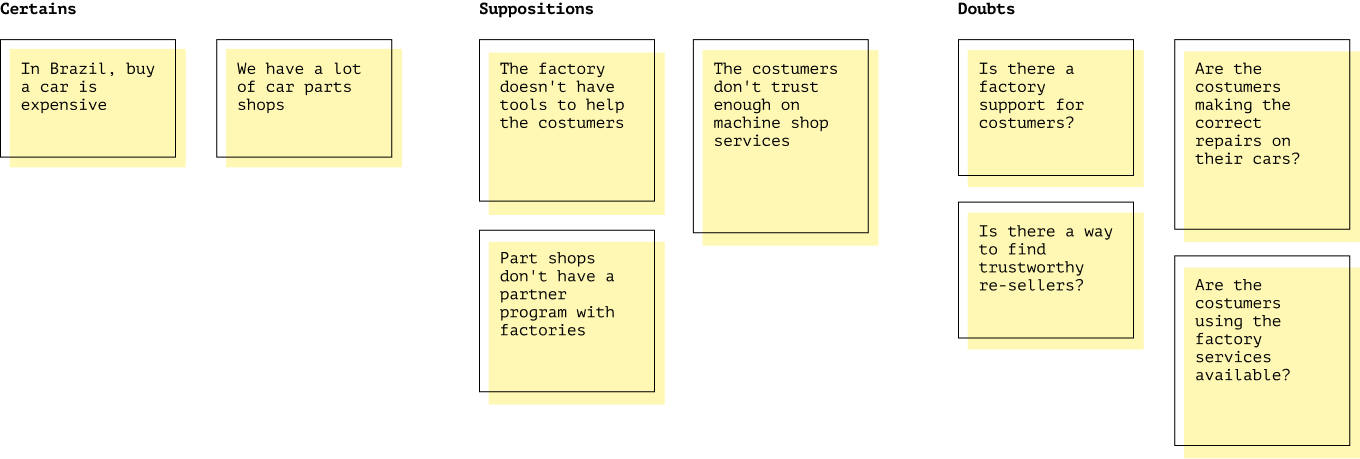
Using the CSD Matrix as the initial search
The first approach was to understand the pain drivers have and their perception of the company and its maintenance services offered.
The choice of the CSD matrix was precisely because it did not have defined information and many doubts about the user perceptions related to Renault. It also serves to leave everyone on the same page of understanding the problem and helps to have a brief view of the unstructured information that can be validated in other research methods.
Desk Research
Before starting a survey, we decided to do a Desk Research format survey to collect some more data to understand the Brazilian market, even in an initial stage. Being them, we obtained some data like:
By 2013, Renault had produced 2,628,208 units worldwide.
60% of drivers in Brazil take the car to the part shop when it breaks down
On average 14% of accidents happen on roads and 48% in urban centers.
By 2013, Renault was in 128 countries including Brazil.
Questionnaire (Quantitative Survey)
The survey was done in an online format to collect as much information about users as possible. We interviewed 43 people in Brazil with a profile of 18 to 60 years and who had Renault cars.
68%
take the car for maintenance
90%
would use a service that helps to avoid car trouble
37%
think that services are expensive
74%
would accept to receive promotions and discounts
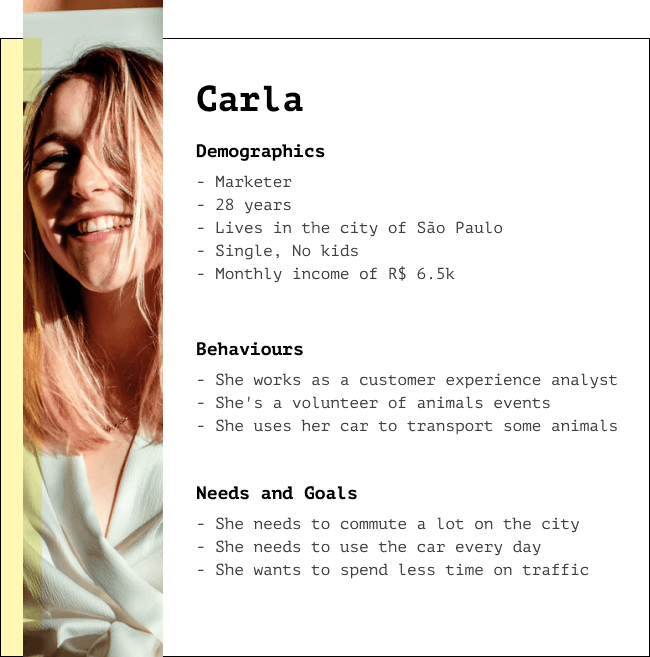
Proto-persona as decision support
We created a persona with data gathered from quantitative research, CSD Matrix and Desk Research to better base and understand what the drivers' motivations would be and how to align what the product could deliver as a result.

02. Deciding what to build
Mapping user's needs
From here on, the process was to converge the findings to start structuring the solution proposal. A matrix of notes was structured to approximate the needs of users with what the product could deliver.

First ideas
With the structured matrix, we could present to the skateholders the findings so far. It was important in this step to understand if we were on the path Renault expected. The initial path was to think of a solution through an application where users could have a direct channel with Renault.
Analysis of competitors
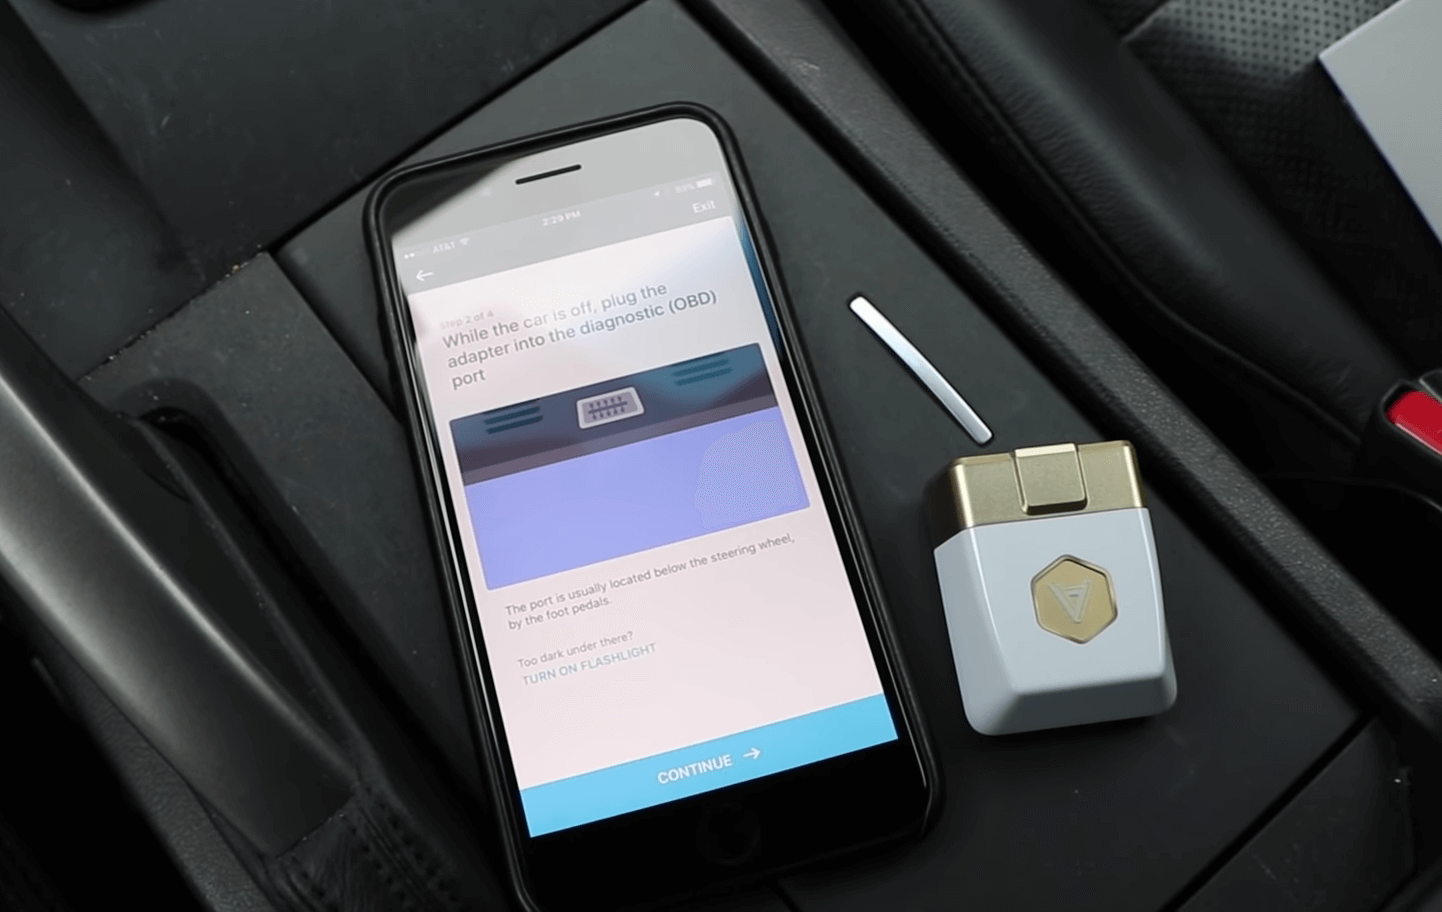
As the project premise was based on connected cars. A market analysis was necessary to understand what services existed at the time and how we could think of ways to create a concept using the available technologies. The Automatic application, in the USA, uses a device that is connected to the OBD port of the vehicle to transmit vehicle usage information. This served as a reference for us to test concept ideas for the solution.
Testing hypothesis
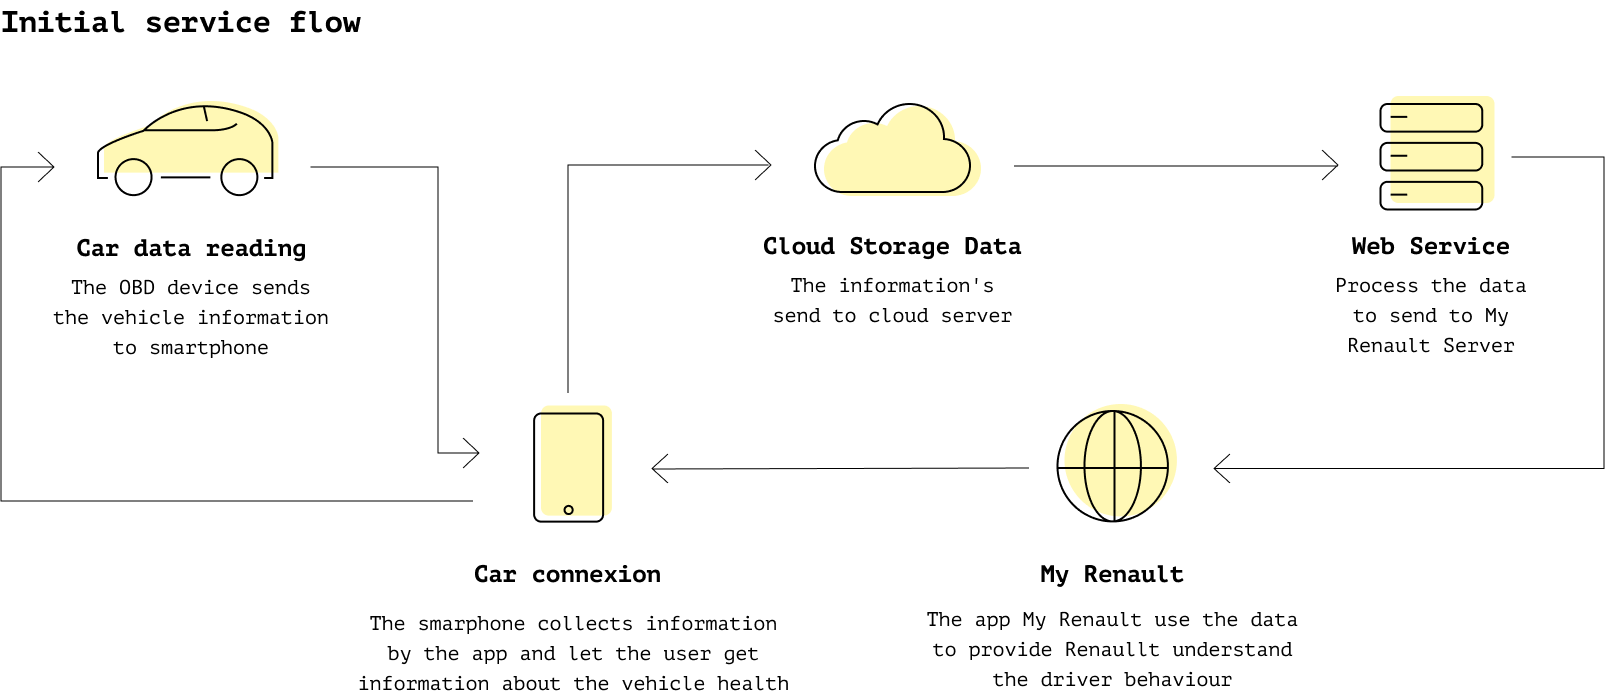
Renault has a service called My Renault that serves as a point of contact for news and updates for users, but little explored by users, according to the company. The idea of connecting the vehicle with the user and the My Renault service was the hypothesis that could meet the initial needs of the company and would meet the pain of users.
A more detailed flow of what this connection would look like helped to have a clearer view. From this, the stakeholders validated the ideas from the business point of view, but we needed to go further to deliver value to the user.
Solution Resources
In discussion with the team, we did a mapping of ideas collected in the survey and initially aligned with stakeholders. The step here was to suggest possible resources for the service. An opportunity matrix helps define what to prioritize in the project and test with users in usability tests.

03. Building the idea
Structuring the solution
At this stage we had already defined what we would work on as a solution idea that would be an application that would connect with the vehicle and the My Renault service, to deliver to the user information about the vehicle, promotions and preventive maintenance.
Userflow
A flow of use of the application helps to understand the amount of screens available, complexity of interaction and structural vision for all involved in the project development process.
Wireframes and notes
In the wireframe step detailing the information helps to discuss with the team what makes sense or not before creating the final version of the application, optimizing team time.

UI Design
The first version of the final application was made without much refinement due to the time available and the need for validation. With few features, the idea was to quickly validate with stakeholders the project idea in its experimental version.
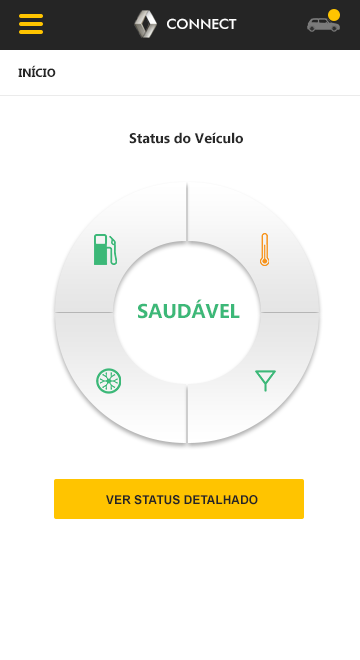
Dashboard
Shows the most important items for the user

View all items
The user can see the list of car items that provide data in the application
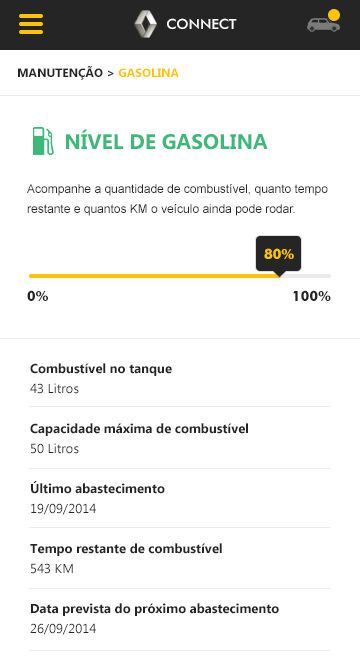
Detailed information
The user can have the data in detail for each item of the vehicle
Prototype
During the event, a navigable prototype helped stakeholders to have a better view of how the application would behave and how we could discuss functionality in future versions of the project.
2.0 App Design
I worked on a new version of the application interface to explore new ways to bring a better experience as possible to the solution. Initially, I made 3 screens for this concept.


04. Learnings and outcomes
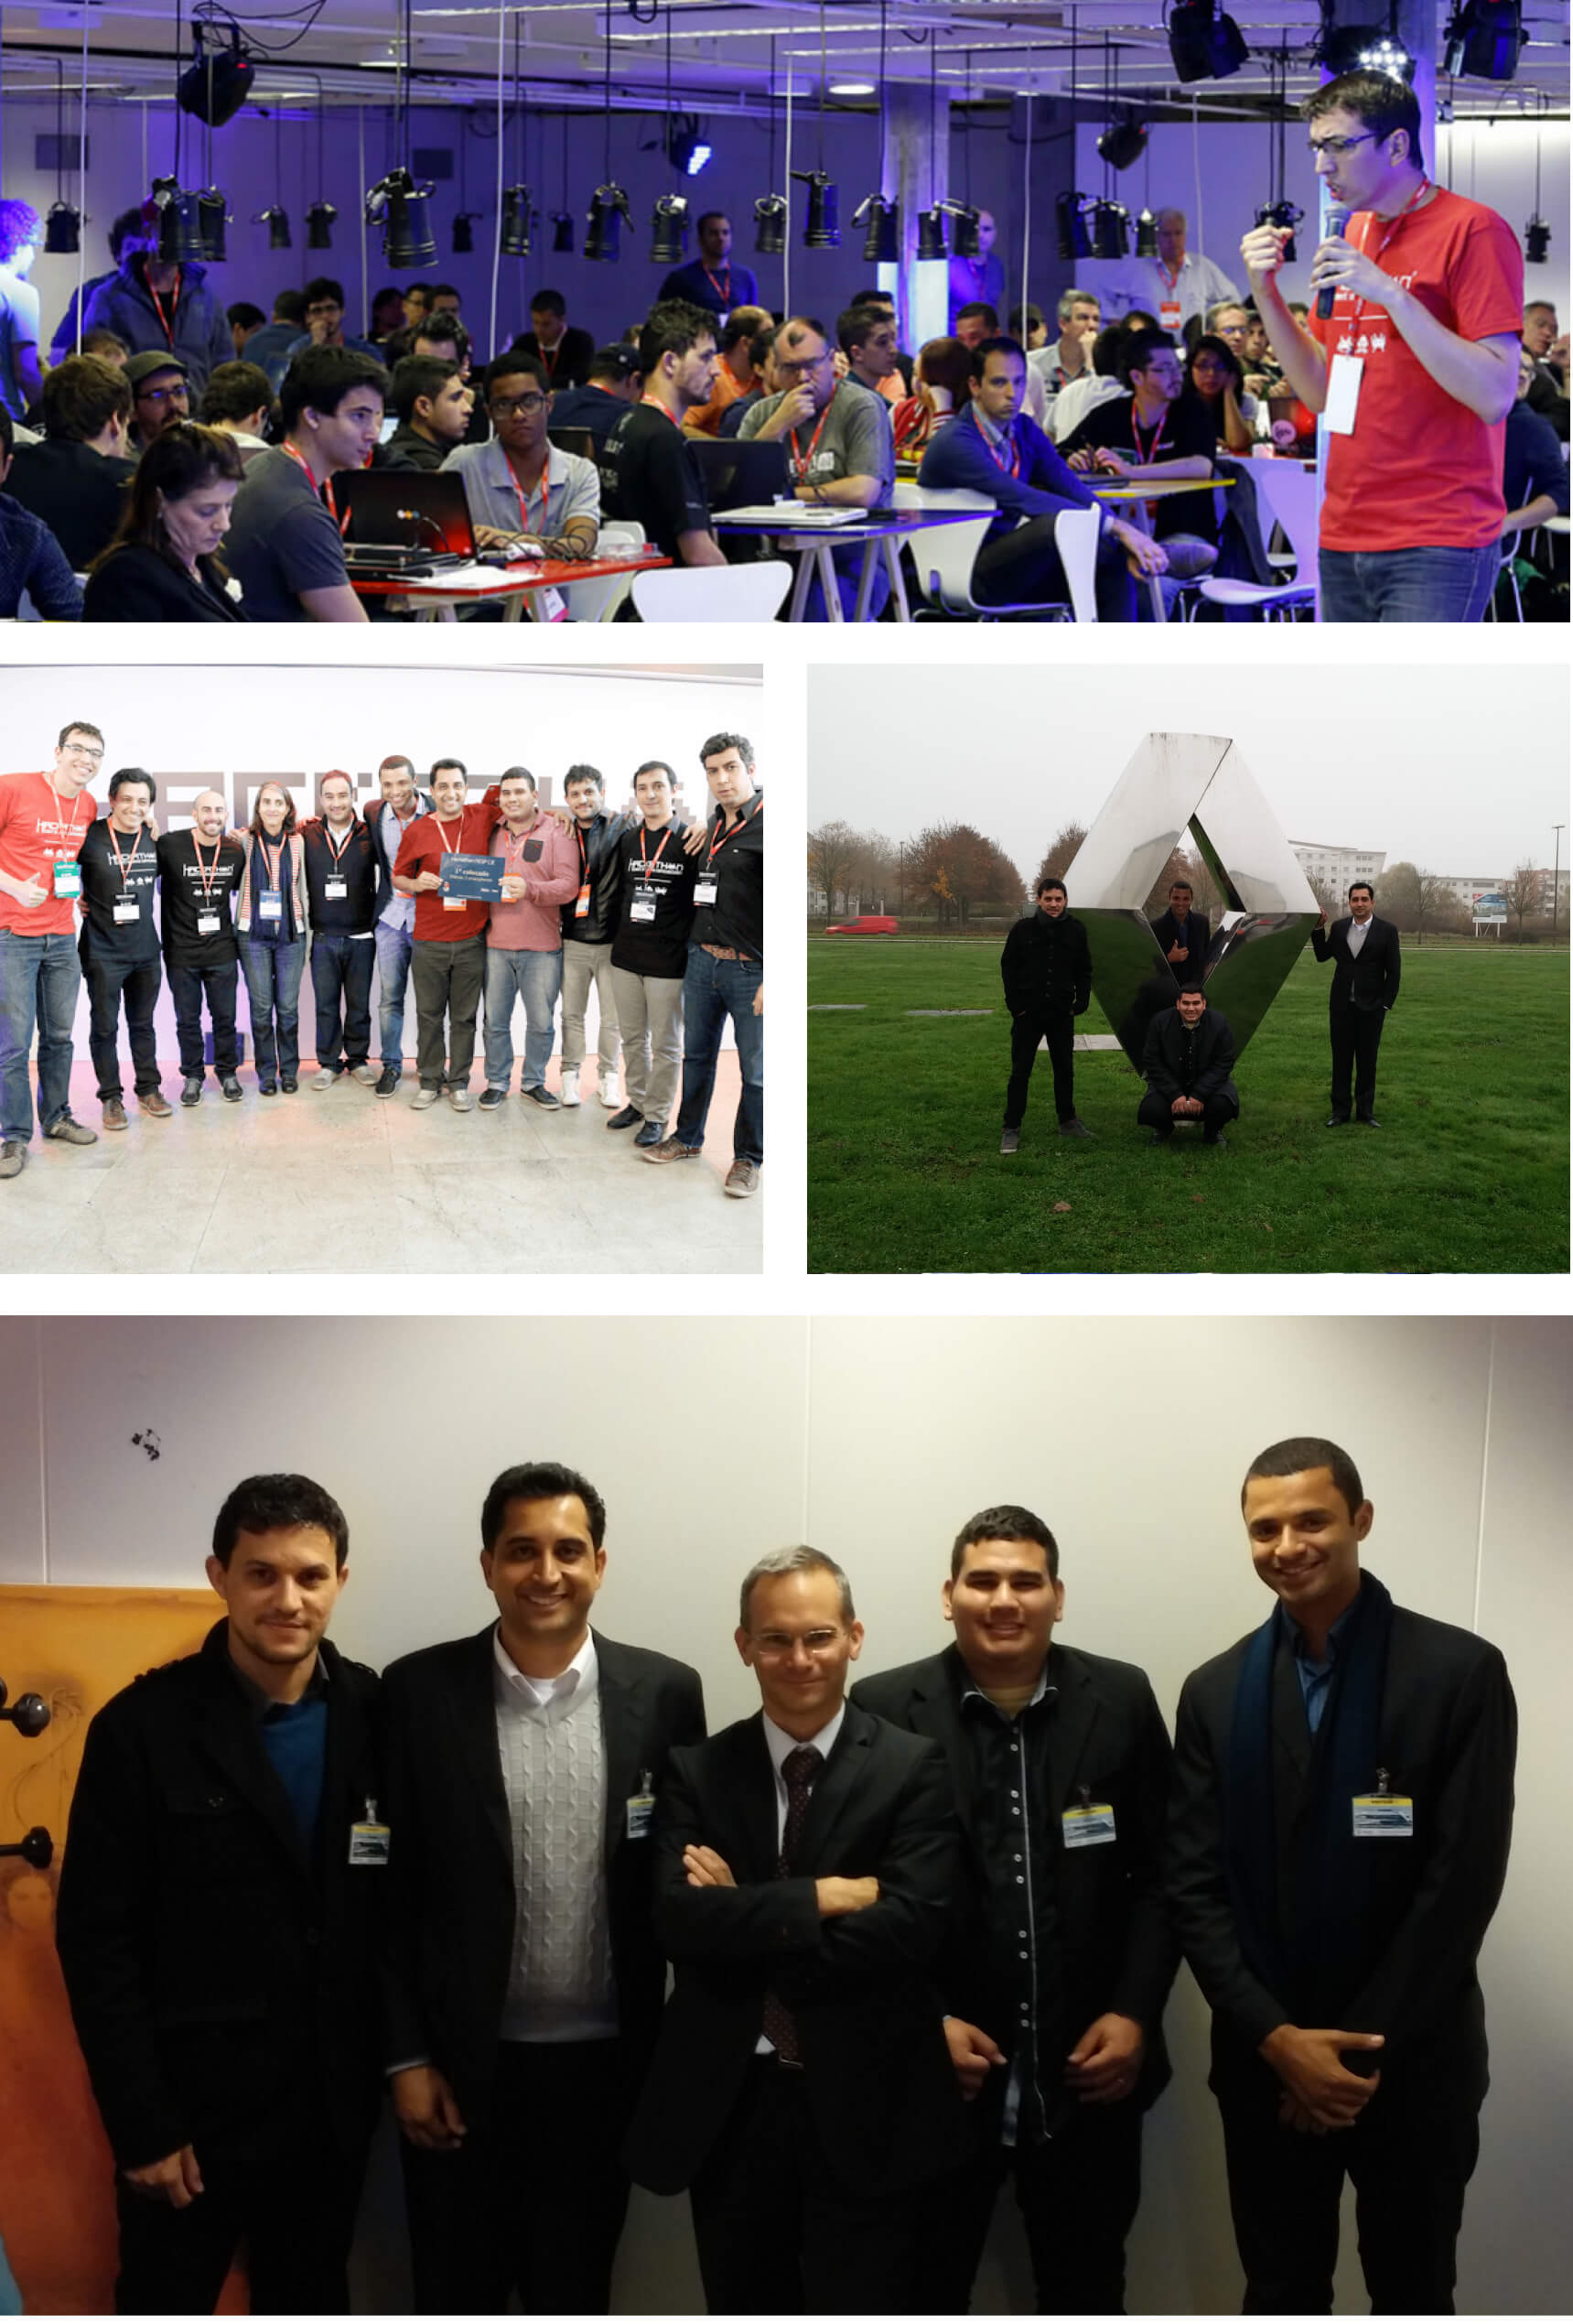
Winner idea
Among the ideas of other groups, our project was the winner. This earned us a trip to Renault's technical center in Paris, where we would make a presentation to the business team, with the aim of expanding the solution at a scalable level to countries other than France. Read more.
Real use scenario
We made a video to show how the app would behave in a real usage scenario. This helped Renault's engineering team to have a better view and discuss what would make sense in technology matters.
Future projects
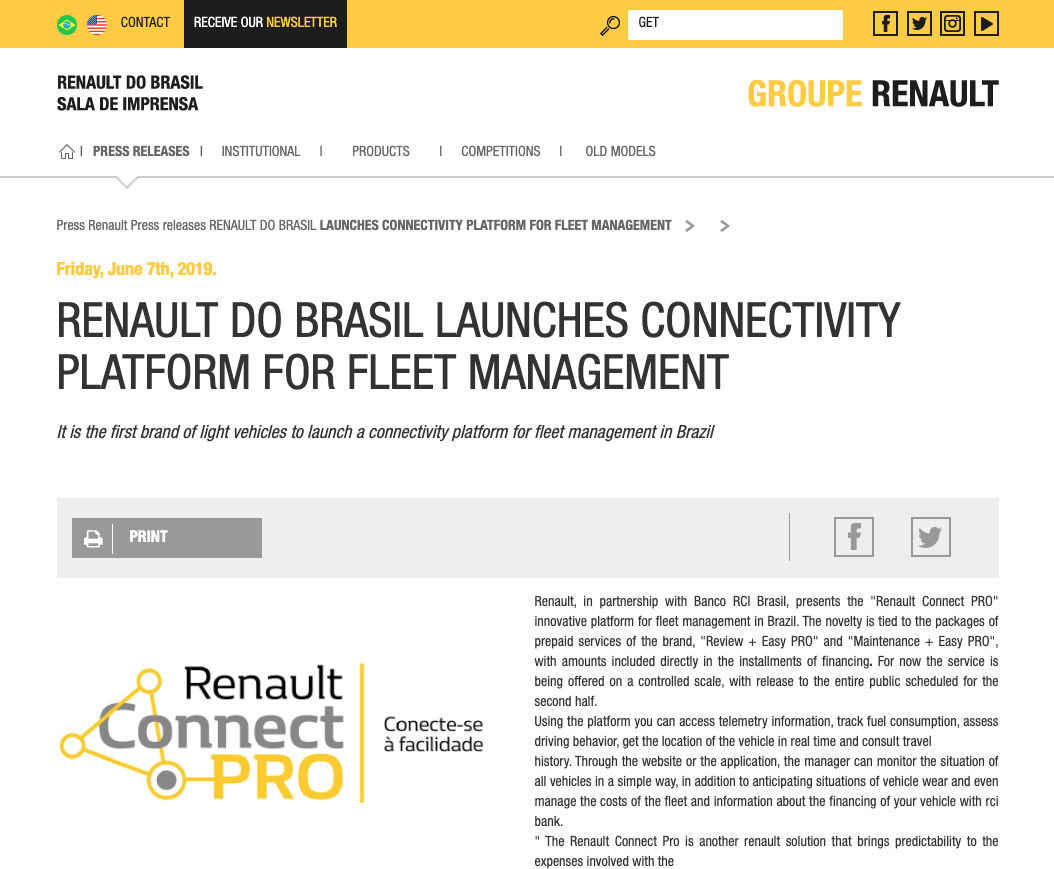
Although the project has not been officially published, Renault can be insights at early operating levels for future projects. One of them, which was related to the findings and insights of the event was the Renault Connect Pro application, which uses the same structural idea of vehicle behavior analysis, consumption history but in truck fleets for companies in Brazil.
Learnings
This project was one of the most I learned and had experiences in business, design, and collaboration. Although it wasn't officially launched, I was very inserted into a universe I didn't know about. The project was made in 2014 but I still consider it one of the ones I most enjoyed participating in.


