

2020 / App Design
05. Fittz

Building a concept app to gather and organize information from connected devices.
Context
A connected device company set me the challenge of creating a solution that could better collect and organize data for people who use racing applications.
Solution
The solution was to create an application that would meet the need of the corridors informing only some data in a direct way so that the user could follow the evolution of exercises both on the smartphone and smartwatch.
Project goal
- Engage users to use the application;
- Gather insights and understand user behavior;
My role
Product Design, Research
Time of project
3 days
01. Framing the problem
Understanding
the context
The company provided the problem based on its own perception of its technology. I framed the problem trying to understand the keywords related to the context.
"The data that comes from the connected devices is interesting but messy. There is no prioritization or clarity on the progress towards a healthy life. Looking at the lines of data, numbers, and charts for each of the measurements and their aggregations, one can't really make sense of it. Understanding what they see, whether they are doing good or bad and gathering any conclusion turns out to be difficult."
Extracting ideas
- Data from the connected devices;
- Messy information;
- Prioritization of information;
- Clarity on progress;
- Data visualization (numbers, charts, measurements, etc…);
- What to do with the information;
Talking to real users
The interviews help to bring more insights about the user needs and to validate the initial assumptions from the proto persona. At that moment, I gathered information about real users and I tried to make my research more assertive. I made qualitative research and ask the following questions:
1. What kind of device do you have?
2. How often do you use your connected device?
3. What information do you expect from your connected device?
4. Tell more about the difficulties that you have using your connected device and how clear the information is?
4
participants use their devices every day to measure activities
3
participants don't know how to track the activity progress
4
participants have Smartphones
and Smart Watches
4
participants want to connect with their friends
Creating a Proto-persona
A proto-personal helped me structure where I could direct the efforts and pains based on the initial interview with users. It was very helpful since I had little data to develop this project.

Going further using the Jobs Stories
I used the Job Stories framework to better contextualize user behavior based on persona. This helped to think about possible scenarios for using the solution and how resources could be addressed in the process.
Story 1
When I want to measure the heart beating, I want to know if is normal, so I can prevent diseases in the future.
Preventive behavior
Story 2
When I’m going running I want to connect with my friends, so I can challenge them and share my progress.
Social behavior
Story 3
When I see my activities reports, I want to get the information in an easy way, so I can follow my progress.
Informative behavior
02. Ideation
Deciding what to build
Prioritization on features helps me define what I will bring to the solution. So, I decided to make an opportunity matrix to think about the product in an early and future scenario based on the first research, user's pain, and perception.

Sketches and Visual Design
I created the first wireframes with ideas on paper and then turned them into digital. This helped me to scribble the screens that I wanted to show as features. I also scribbled the solution for the smartwatch because it would also be important for product engagement and working on it was just as important as the application.
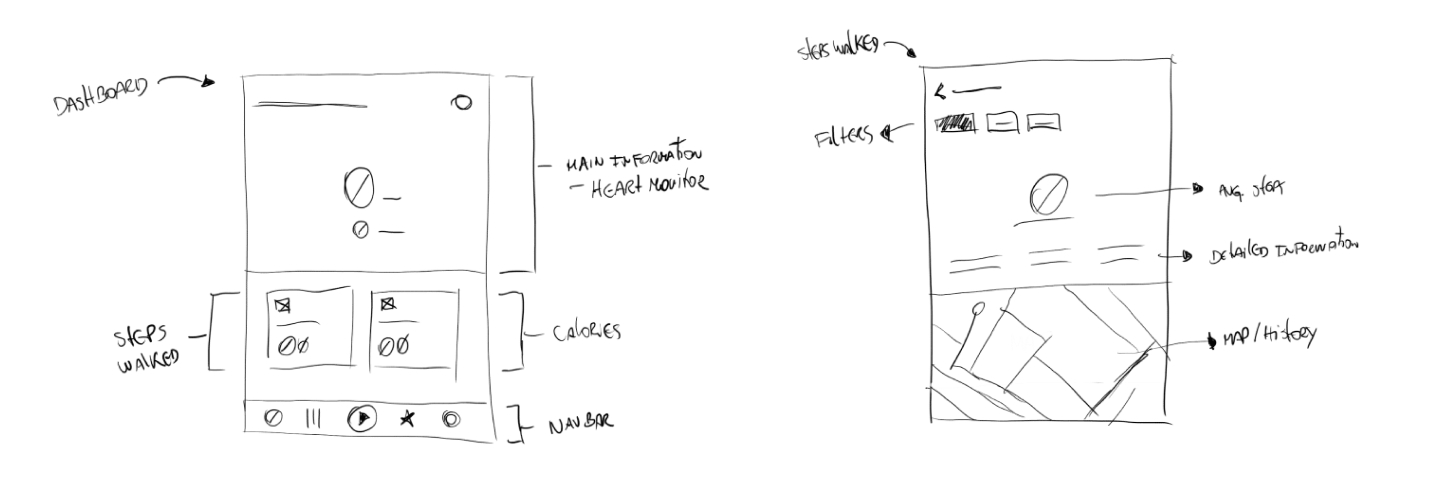

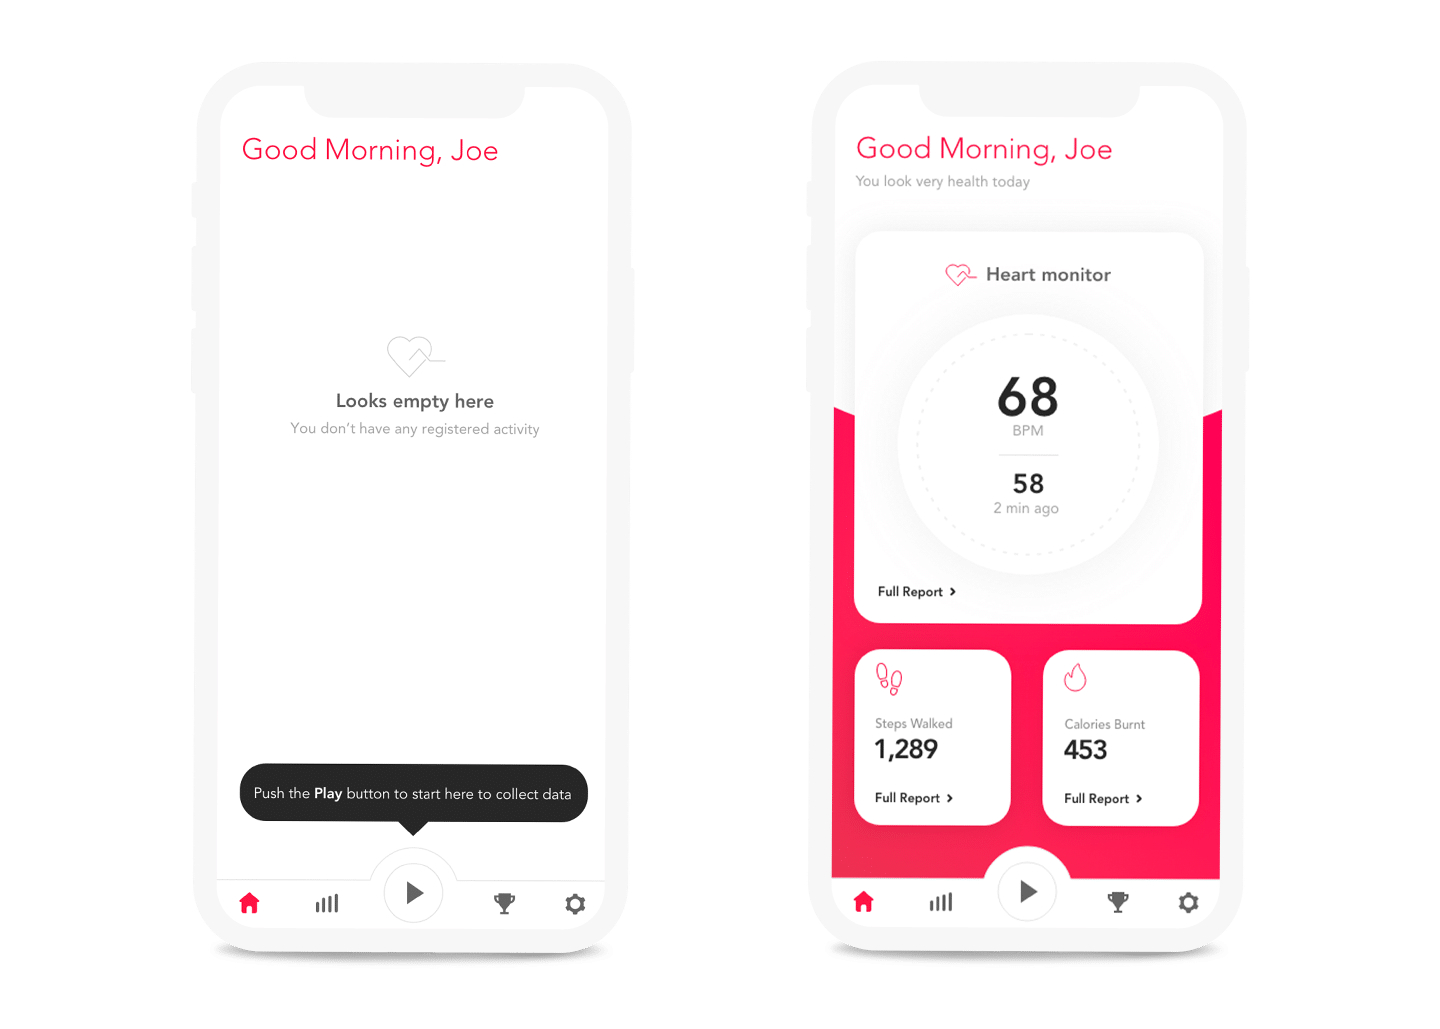
Dashboard
The main screen shows 3 features (Heart Monitor, Steps Walked & Calories Burnt) based on research perceptions. The idea here was left very simple to understand each of them.
Capturing Health Data
This screen captures the data from a smartphone in real-time, providing to the user the health conditions. The user can see the progress on the SmartWatch.

Reports | Steps Walked
The report is generated from data capture and it is shown to the user how many steps walked by day, week, month, and year, the average time, pace, and distance in infographic format.

Prototype
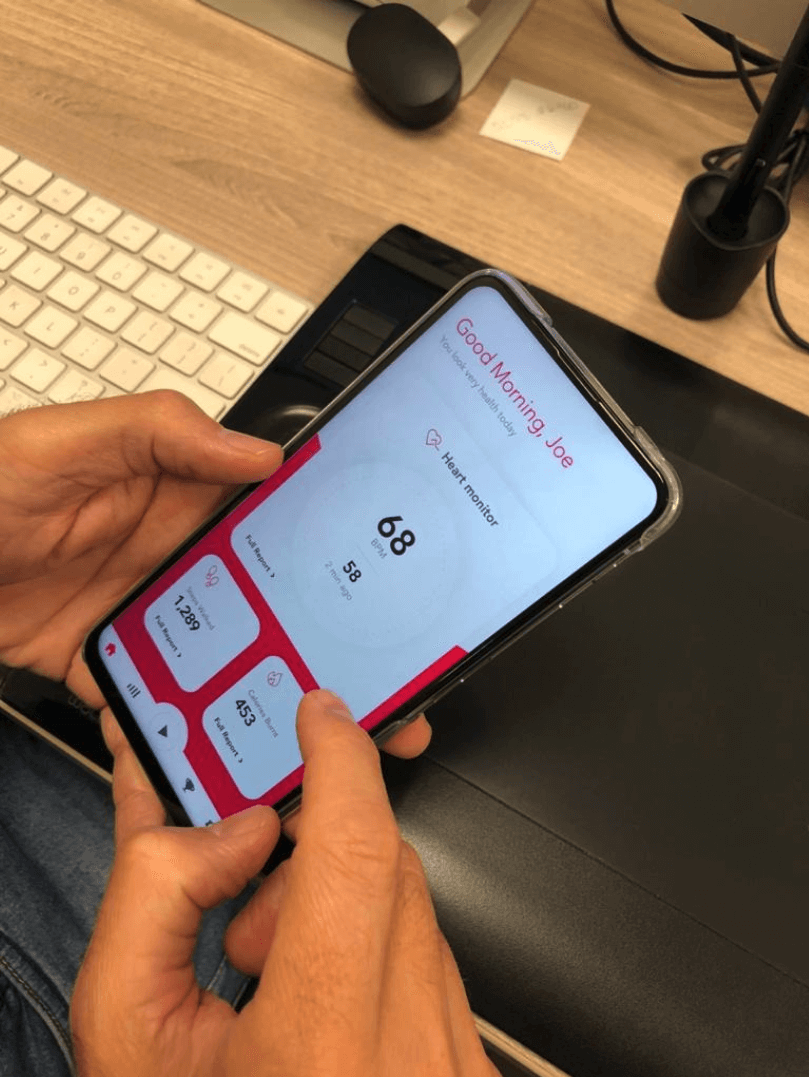
I decided to make a prototype to make the project more understandable and interactive. Based on this I could test with real users to understand if the expectations mapped in research, made sense.
03. Improving the idea
Testing the solution
To understand better if the design was good enough to bring the information based on the opportunity matrix, I tested the prototype with one of the participants.
Guerrilla Usability Test
This sample comes from the Dashboard screen where the participant brings some insights to improve the interface.
First perception
- The interface is clean;
- Essential information on-screen;
Improvements suggestions
- Bring more information about Heart Beat Rate;
- Add a Running feature but Steps Walked;
Improvement
Adding an informative about the ideal heart beating rate can help the user understand better the heart health level in an easy way. The Running Feature can be worked in the second phase of the app.


Learnings
I had the opportunity to do this work and test with real users in a selection process context. I chose to leave this project in my portfolio because it was a work experience that I consider satisfactory in visual issues and where I could improve my research process and user understanding.